Shorts and Clips
2026-06-09
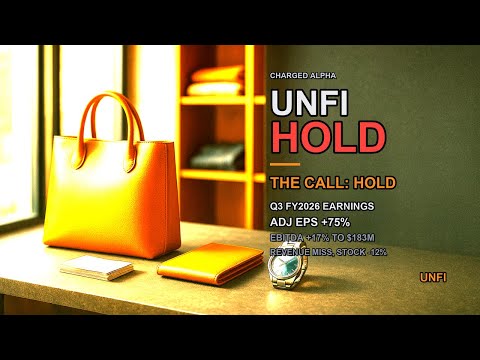
UNFI Stock: Q3 FY2026 in 60 Seconds #Shorts
A fast Charged Alpha clip pointing viewers into the latest earnings coverage.
Live stock metrics, chart context, a quarter-by-quarter episode archive, and a deeper competitor comparison so this page behaves more like an investor workspace than a flat episode link page.
Library coverage
Company context
Price chart
Competitive view
This section compares the current company against two nearby peers on valuation, growth, margins, balance-sheet strength, and investment setup. Green generally marks the strongest relative figure for that row, while red marks the weakest.
 YouTube
 YouTube
 YouTube
Related research
Special-topic videos, explainers, and shorts connected to this ticker.
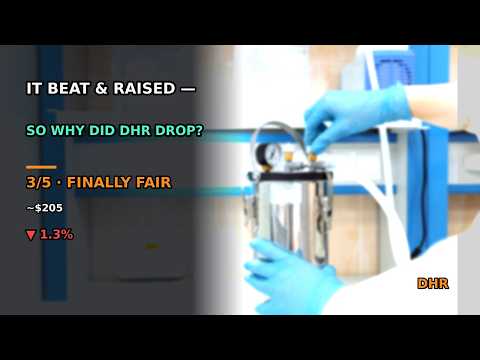
A fast Charged Alpha clip pointing viewers into the latest earnings coverage.
A fast Charged Alpha clip pointing viewers into the latest earnings coverage.
Episode timeline
Each row is one earnings episode with every verified platform link available.