CHARGED ALPHATMFrontier AI stock research

ANAB · NasdaqGS

AnaptysBio, Inc.

Biotechnology · United States

USD 48.770.8% daily changeQuote 2026-11-11 · USD
Market cap (USD)
US$1.46B
Trailing P/E
—
Forward P/E
10.75x
Quarterly revenue growth
23.5%
Trailing net margin
247.0%
Indicated dividend yield
—

Snapshot 2026-11-11 · Latest financial period 2026-06-30 · Yahoo Finance. Quotes may be delayed; reporting periods can differ.

Company background

AnaptysBio, Inc. discovers and out-licenses therapeutic bodies in the United States. The company manages financial collaborations for Jemperli, a PD-1 antagonist for various solid tumor indications; and Quimilza, an IL-36R antagonist mAb, which has completed two registration-enabling global Phase 3 trials, and GEMINI-1 and GEMINI-2, evaluating the safety and efficacy of Quimilza in patients with generalized pustular psoriasis. It has a collaboration and exclusive license agreement with GSK plc to develop Jemperli as a monotherapy; and an exclusive license agreement with Vanda Pharmaceuticals Inc. for the development and commercialization of Quimilza. The company was formerly known as Anaptys Biosciences, Inc. and changed its name to AnaptysBio, Inc. in July 2006. AnaptysBio, Inc. was incorporated in 2005 and is based in San Diego, California.

Company website

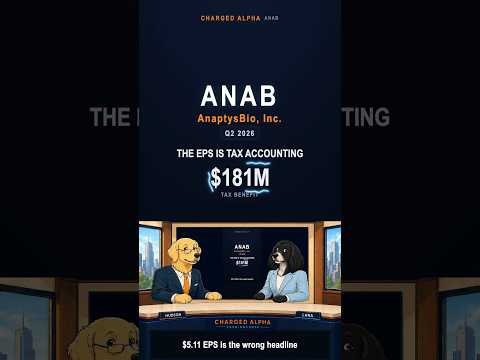
Q2 2026

Go beyond the headline.

ANAB Stock: $5.11 EPS Is the Wrong Headline — AnaptysBio Q2 2026

Published 2026-09-21

Q2 2026 REPORT HIGHLIGHTS

What’s changed for ANAB

Anaptys reported growing Jemperli royalties, a one-time tax-driven profit and an unresolved contract case; our HOLD values post-Sagard cash at $58 per share.

  1. Royalties are growing.

    H1 Jemperli sales rose 30.3%, pushing Anaptys toward higher contractual tiers.

  2. The profit headline is misleading.

    Q2 pretax loss became a large profit only after a $181.491M tax benefit.

  3. Sagard still gets paid first.

    About $302.5M had been earned; management estimates paydown in H2 2027.

  4. The contract is in court.

    Trial is complete, the October 20 hearing remains ahead and the remedy is unresolved.

  5. The cash narrative does not reconcile.

    Audited operating outflows total $52.559M, not the release's $72.9M sentence.

Comparable businesses

ANAB peer comparison

Same business group first, then company size. Preferred market cap: 0.5–2x; extended range: one-third–3x. Outside that range, industry benchmarks are labeled separately and excluded from peer medians.

Comparison stocks

No suitable peers with fresh, comparable size data are available. We have not substituted unrelated companies.

Market metrics · missing or inapplicable values shown as —
MetricANABAnaptysBio, Inc.Snapshot 2026-11-11Financial period: 2026-06-30
Market capMarket value, converted to USDUS$1.46B
Forward P/EProvider forward earnings estimate10.75x
EV / EBITDAEnterprise value / trailing EBITDA23.61x
Revenue growthLatest quarter vs prior-year quarter23.5%
Operating marginLatest reported quarter61.9%
Free cash flow yieldTrailing cash flow / market cap—
Net debt / EBITDANet debt / trailing EBITDA1.60x
Debt / equityTotal debt / positive book equity25.47x
Trailing P/ETrailing twelve-month earnings—
Price / bookPrice / positive book equity per share136.99x
EV / salesEnterprise value / trailing revenue14.63x
Earnings growthLatest quarter vs prior-year quarter—
Gross marginTrailing twelve months105.0%
Net marginTrailing twelve months247.0%
Return on equityProvider trailing return; positive equity only—
Free cash flow marginTrailing free cash flow / revenue—
Dividend yieldIndicated annual dividend / price—
Earnings payoutProvider trailing dividend payout0.0%
Current ratioCurrent assets / current liabilities5.61x
BetaProvider historical market sensitivity0.37

Choose a comparison stock

Search covered companies, or search all listed stocks.

Comparison methodology & limitations

Reviewed operating groups override broad sector classifications. Other companies are matched only within a sufficiently specific provider industry. Business mix, geography and accounting standards can still differ. Market caps are converted to USD using exchange rates captured during the snapshot refresh. Financial ratios that would mix currencies are omitted. Snapshots must be at most 14 days old and no more than seven days apart for automatic selection.

Peer medians require at least two valid similar-size peers for each metric. Negative earnings, nonpositive equity, missing data and irrelevant bank ratios are not presented as attractive valuations. A higher or lower number is not automatically a better investment. Financial statement periods are not calendar-aligned across companies.

Reported performance

Financial trends

Reporting period
Financial history
Chart style
Comparison stocks

Financial statements load separately from the research page.

Market context

Valuation & price history

Adjusted closing price

Price history

Price history loads separately.

Earnings-multiple scenario

Illustrative price = your earnings-per-share assumption × your P/E assumption. This is not a price target or a complete valuation model.

Starting assumptions, when available, use provider forward estimates as of 2026-11-11. Negative earnings require a different valuation method. This calculation omits balance-sheet, dilution and execution risks.

THE RESEARCH RECORD

Research history for ANAB

All available reporting periods
Q2 20262026-09-21

Reported figures

Verify material figures against company filings. Market data and AI-assisted analysis may contain errors.